

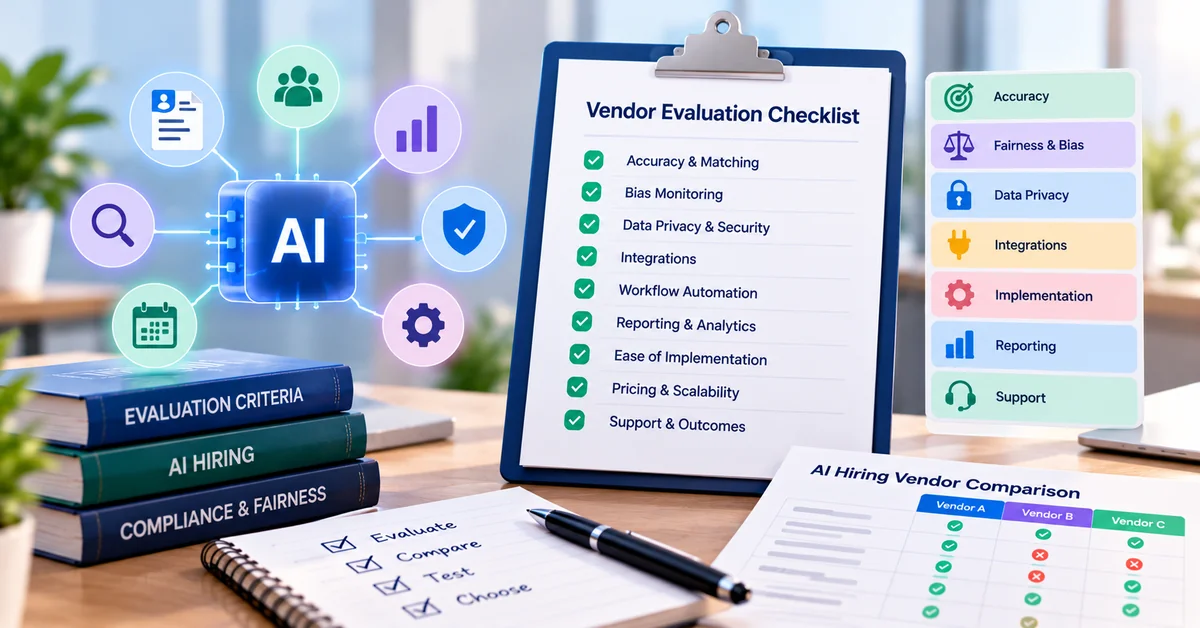


What is predictive hiring ROI? It’s the financial return a company gets from using data-driven candidate assessment and forecasting tools, measured by comparing the cost of the technology against the money saved or recovered through faster hiring, fewer bad hires, and better-performing new employees. For a recruiting leader asking for budget, it’s the number that turns “this tool feels useful” into a figure a finance team can evaluate.
Recruiting technology is easy to justify on instinct and hard to justify on paper. A hiring manager can feel that a slow, instinct-driven process is costing the business money, but “it feels slow” doesn’t survive a budget review. What does is a business case built on the metrics finance already trusts: cost per hire, time to hire, and the downstream cost of hiring the wrong person. This article walks through how to build that case, with a transparent formula, an illustrative worked example, and the mistakes that undermine credibility once the numbers reach a CFO.
What Predictive Hiring Analytics Is
Predictive hiring analytics uses structured data — assessment scores, historical performance patterns, application and interview behavior — to estimate which candidates are likely to succeed in a role before they’re hired, and to forecast process outcomes like time to fill. Traditional recruiting analytics is mostly descriptive: it reports what already happened (how many people applied, how long the last five hires took) rather than estimating what’s likely to happen next.
The distinction matters for a business case because the two produce different kinds of value. Descriptive analytics helps a team see a problem, such as a role stuck in screening for three weeks. Predictive analytics tries to prevent a different kind of problem before it happens — flagging that a candidate’s profile doesn’t match the traits of the team’s strongest performers before an offer goes out, rather than six months into a bad fit. An influential meta-analysis by Schmidt and Hunter, drawing on 85 years of personnel-selection research, found unstructured interviews predict future job performance at a validity of about .38, while structured interviews and general cognitive-ability tests reach about .51 — a gap that compounds across dozens of hires a year.
The Business Costs of Ineffective Hiring
Ineffective hiring shows up on the income statement in ways that are easy to underestimate. SHRM’s 2025 Recruiting Benchmarking Report found the average cost per hire for nonexecutive roles was $1,200 in 2025 — and that’s before counting what happens when the hire doesn’t work out. A widely cited 2011 Leadership IQ study, based on more than 20,000 hires tracked across 312 organizations, found 46% of new hires were considered failed within 18 months, and attributed 89% of those failures to attitude-related factors — coachability, emotional intelligence, motivation, and temperament — rather than a lack of technical skill. That finding matters for a predictive-hiring case specifically, because it suggests the biggest risk in a hiring decision often isn’t visible on a resume, which is the exact gap structured assessment is built to close.
The same SHRM report found only 20% of organizations currently measure quality of hire at all, down from 27% in 2022 — meaning most companies can’t yet show whether a hire actually worked out, let alone connect that outcome back to how the hire was made.
The Metrics That Make Up a Predictive Hiring ROI Case
A credible ROI case rests on six metrics, each capturing a different part of the hiring funnel’s cost and value:
1. Cost per hire — total recruiting spend (advertising, agency fees, referral bonuses, recruiter time, technology) divided by the number of hires in a period. SHRM’s 2025 benchmark puts this at $1,200 for nonexecutive roles and $10,625 for executive roles.
2. Time to hire (time to fill) — days from opening a requisition to an accepted offer. SHRM’s 2025 data puts this at roughly six to seven weeks across role levels.
Quality of hire — how well a new employee performs against the role’s expectations, typically tracked through performance ratings, manager evaluations, or retention at set milestones (90 days, 6 months, 1 year).
3. New-hire retention — the share of hires still in the role at set checkpoints; a hire who leaves inside the first year erases most of the savings a faster or cheaper hiring process produced.
4. Recruiter productivity — hires, or qualified candidates advanced, per recruiter per period; automation that removes manual scheduling or screening work shows up here first.
Interview-to-offer and offer-acceptance rates — how efficiently qualified candidates convert to offers, and how often those offers are accepted; a low acceptance rate can quietly inflate cost per hire by forcing a second search.
Each metric should be tracked on its own baseline before and after any predictive-hiring investment — a single blended number across all six hides which part of the case is actually working.
A Framework for Building the Business Case
Building a defensible case follows a consistent sequence:
Establish a baseline. Pull 6–12 months of the metrics above from existing ATS and finance data before changing anything.
Define the problem in dollar terms. Translate the worst-performing metric — often cost per hire or the new-hire failure rate — into an annual cost.
Select a pilot. Choose one role family or department to trial predictive assessment rather than rolling it out company-wide immediately.
Estimate costs and benefits. Build the ROI calculation (below) using conservative, clearly labeled assumptions.
Run the pilot and measure. Track the same six metrics for the pilot group against a comparable control group or the historical baseline.
Compare and decide. Present realized results alongside the original projection, and be explicit about what changed between the estimate and the outcome.
Calculating the ROI: A Worked Example
The formula is straightforward: ROI (%) = [(Financial Benefits − Total Investment) ÷ Total Investment] × 100. The work is in defining the inputs honestly.
The table later in this document is an illustrative example only — a hypothetical mid-market company hiring 50 people a year, not a benchmark or a guaranteed outcome. In it, total first-year investment (platform subscription plus setup and training time) comes to $11,000. Financial benefits are built from three separate, non-overlapping categories: avoided bad-hire replacement costs, recruiter hours saved through automation, and reduced job-board spend from consolidated posting — together totaling $46,000. That produces an ROI of roughly 318% and a payback period under three months.
Two things make a calculation like this defensible rather than a sales pitch. First, every assumption is stated and conservative — the example assumes 2 avoided bad hires, not a company-wide transformation. Second, the three benefit categories don’t double-count the same underlying driver: time saved by automated scheduling is counted once, as recruiter productivity, not again as a separate “faster time to hire” dollar figure, since both numbers trace back to the same root cause.
Baseline, Pilot, and Comparison, in Practice
A pilot only produces a usable number if it’s compared against something. The cleanest comparison is a control group: roles or locations hired the old way during the same window, not last year’s numbers, since hiring conditions — applicant volume, labor market, compensation changes — shift year to year and can make an old comparison misleading. Where a true control group isn’t practical, comparing the pilot’s results against its own pre-pilot baseline for the same role family is the next-best option. Either way, give the pilot enough hires and enough time — most teams need at least one full hiring cycle, including a 90-day retention checkpoint — before drawing a conclusion. A handful of good hires in the first month can be the labor market, not the tool.
Direct and Indirect Benefits
Direct benefits are the ones that show up on a budget line: lower cost per hire, reduced job-board spend, fewer agency fees for roles the team can now fill internally. Indirect benefits are real but harder to isolate in a spreadsheet: a hiring manager who spends less time re-interviewing for a role that didn’t work out the first time, a recruiting team with more capacity to focus on hard-to-fill roles instead of repeat searches, and a candidate experience that holds up because fewer people are rushed through screening to hit a deadline. Both belong in a business case, but they should be labeled separately — a finance reviewer trusts a case more, not less, when it’s honest about which numbers are measured and which are reasoned estimates.
Common Measurement Mistakes and the Limits of the Model
The most common mistake is double-counting: crediting the same dollar saved to two different line items, most often time-to-hire improvement and recruiter productivity, which are usually driven by the same automation. The second is treating a small pilot’s early results as proof rather than a signal — a handful of hires is not a sample size that survives scrutiny.
Predictive hiring analytics also has real limitations worth stating plainly. Any model is only as good as the data and the “top performer” profile it’s trained on; if that profile reflects a narrow slice of past hires, the model can reproduce the same blind spots at scale, including selection bias against qualified candidates who don’t resemble the existing team. Correlation is not causation: if quality of hire improves after adopting a new assessment, a tighter labor market, a compensation change, or a different hiring manager could explain some or all of the shift, and a rigorous business case says so rather than giving the tool sole credit.
Presenting the Case to Finance and Executive Stakeholders
Finance leaders evaluate a business case the way they evaluate any capital request: clear inputs, a stated payback period, and an honest account of risk. Lead with the cost of the status quo — the baseline numbers from the framework above — not the product’s features. Show the ROI calculation with its assumptions visible, not buried in an appendix; a reviewer who can’t find the assumptions will assume the worst about them. State the pilot’s scope and timeline explicitly, and bring comparison data, not just the projection, to the follow-up conversation. A one-page scorecard that shows baseline, pilot result, and dollar impact side by side (a sample appears later in this document) tends to move a budget conversation faster than a longer narrative deck.
Where Recruiting Software Fits
A platform doesn’t create ROI by itself — the framework above does that — but the right tools remove friction at each stage of measuring and running the pilot. SmoothHiring’s predictive hiring tool builds a success profile from a team’s current top performers and scores applicants against it with a structured psychometric assessment, the kind of standardized, repeatable input the Schmidt and Hunter research above associates with stronger predictive validity than unstructured impressions alone. An applicant tracking system that logs stage-by-stage timestamps makes pulling the baseline and pilot metrics — time to hire, interview-to-offer ratio — far less manual than reconstructing them from spreadsheets after the fact. Job distribution software that consolidates posting and reports cost-per-applicant by source feeds directly into the cost-per-hire side of the calculation, and interview-scheduling automation is often where the recruiter-productivity hours in the example above actually come from. None of this replaces defining the baseline and the assumptions first — the tools make the measurement easier, not the case itself.
Next Steps
A predictive hiring ROI case doesn’t need to be perfect to be useful — it needs to be honest about its assumptions, specific about what it measured, and built on a real baseline rather than a vendor’s claim. Start smaller than feels ambitious: one role family, one quarter, one control group. Pull the baseline numbers this week, before any new tool is in place, because that baseline is the only number that gets harder to recover the longer a pilot runs without it.
Illustrative ROI Calculation (Supporting Visual for the Article)
Every number below is a hypothetical assumption for a fictional 50-hire/year mid-market company — not an industry average, a SmoothHiring result, or a guaranteed outcome. Mark this clearly as “illustrative example” wherever it appears on the page.
Investment
Line Item Amount Basis Predictive hiring platform subscription (annual) $9,600 Hypothetical — e.g., ~$800/month Setup, configuration, and training time $1,400 Hypothetical — 20 recruiter-hours × $70/hr loaded cost Total Year-1 investment $11,000
Financial Benefits
Line Item Amount Basis Avoided bad-hire replacement costs $30,000 Hypothetical — 2 avoided bad hires × $15,000 each (illustrative replacement-cost assumption, not a cited benchmark) Recruiter hours saved through automation $10,000 Hypothetical — 250 hours saved (5 hrs × 50 hires) × $40/hr loaded cost Reduced job-board/advertising spend $6,000 Hypothetical — 15% reduction on a $40,000 annual ad budget Total Year-1 financial benefits $46,000
Result
ROI = [($46,000 − $11,000) ÷ $11,000] × 100 = 318%Payback period = $11,000 ÷ ($46,000 ÷ 12 months) ≈ 2.9 months
| Line Item | Amount | Basis |
|---|---|---|
| Predictive hiring platform subscription (annual) | $9,600 | Hypothetical — e.g., ~$800/month |
| Setup, configuration, and training time | $1,400 | Hypothetical — 20 recruiter-hours × $70/hr loaded cost |
| Total Year-1 investment | $11,000 |
Financial Benefits
| Line Item | Amount | Basis |
|---|---|---|
| Avoided bad-hire replacement costs | $30,000 | Hypothetical — 2 avoided bad hires × $15,000 each (illustrative replacement-cost assumption, not a cited benchmark) |
| Recruiter hours saved through automation | $10,000 | Hypothetical — 250 hours saved (5 hrs × 50 hires) × $40/hr loaded cost |
| Reduced job-board/advertising spend | $6,000 | Hypothetical — 15% reduction on a $40,000 annual ad budget |
| Total Year-1 financial benefits | $46,000 |
Result
ROI = [($46,000 − $11,000) ÷ $11,000] × 100 = 318%Payback period = $11,000 ÷ ($46,000 ÷ 12 months) ≈ 2.9 months
| ROI = [($46,000 − $11,000) ÷ $11,000] × 100 = 318%Payback period = $11,000 ÷ ($46,000 ÷ 12 months) ≈ 2.9 months |
Note on avoiding double-counting: the three benefit categories above are deliberately kept separate — automation time savings are counted once (recruiter productivity), not re-counted under a separate “time to hire” dollar figure, since both would trace back to the same root cause.
Sample ROI Scorecard (for presenting to finance)
Metric Baseline Pilot Result Dollar Impact Cost per hire [fill from your ATS] [fill] [fill] Time to hire (days) [fill] [fill] [fill] New-hire 90-day retention [fill] [fill] [fill] Quality-of-hire rating (avg.) [fill] [fill] [fill] Recruiter hours per hire [fill] [fill] [fill] Offer acceptance rate [fill] [fill] [fill]
| Metric | Baseline | Pilot Result | Dollar Impact |
|---|---|---|---|
| Cost per hire | [fill from your ATS] | [fill] | [fill] |
| Time to hire (days) | [fill] | [fill] | [fill] |
| New-hire 90-day retention | [fill] | [fill] | [fill] |
| Quality-of-hire rating (avg.) | [fill] | [fill] | [fill] |
| Recruiter hours per hire | [fill] | [fill] | [fill] |
| Offer acceptance rate | [fill] | [fill] | [fill] |
This scorecard is a template — populate it with real baseline and pilot numbers before presenting; do not publish it with the placeholder brackets.
Frequently Asked Questions
What is predictive hiring ROI?
It’s the financial return from using data-driven candidate assessment and forecasting tools, calculated by comparing platform costs against savings from faster hiring, fewer bad hires, and better new-hire performance.
How do you calculate ROI for a predictive hiring platform?
Use ROI (%) = [(Financial Benefits − Total Investment) ÷ Total Investment] × 100. Total investment includes subscription and setup/training time; benefits should be split into separate, non-overlapping categories such as avoided bad-hire costs, recruiter time saved, and reduced job-board spend.
What is the average cost per hire?
SHRM’s 2025 Recruiting Benchmarking Report found an average of $1,200 for nonexecutive roles and $10,625 for executive roles — a useful baseline reference, not a target, since cost per hire varies by role, industry, and company size.
How is quality of hire measured?
Most commonly through performance ratings, manager evaluations at set checkpoints (90 days, 6 months, 1 year), and retention at those same checkpoints. SHRM reports only 20% of organizations currently measure it at all.
Does a high offer acceptance rate mean hiring is working well?
Not entirely. Interview-to-offer and offer-acceptance rates mainly reflect process efficiency and candidate experience; they don’t indicate whether the people who accept actually perform well, so they need to be read alongside quality-of-hire and retention data.
Can predictive hiring analytics replace human judgment in hiring?
No credible version of this technology is built to replace a hiring manager’s judgment. Structured, data-informed input is associated with stronger predictive validity than unstructured impressions in long-running personnel-selection research, but every model needs human oversight and is limited by the data it was built from.
How long should a predictive hiring pilot run before evaluating results?
Most teams need at least one full hiring cycle per role, including a 90-day retention checkpoint, before drawing conclusions — a handful of early hires isn’t a large enough sample to separate the tool’s effect from normal variation.